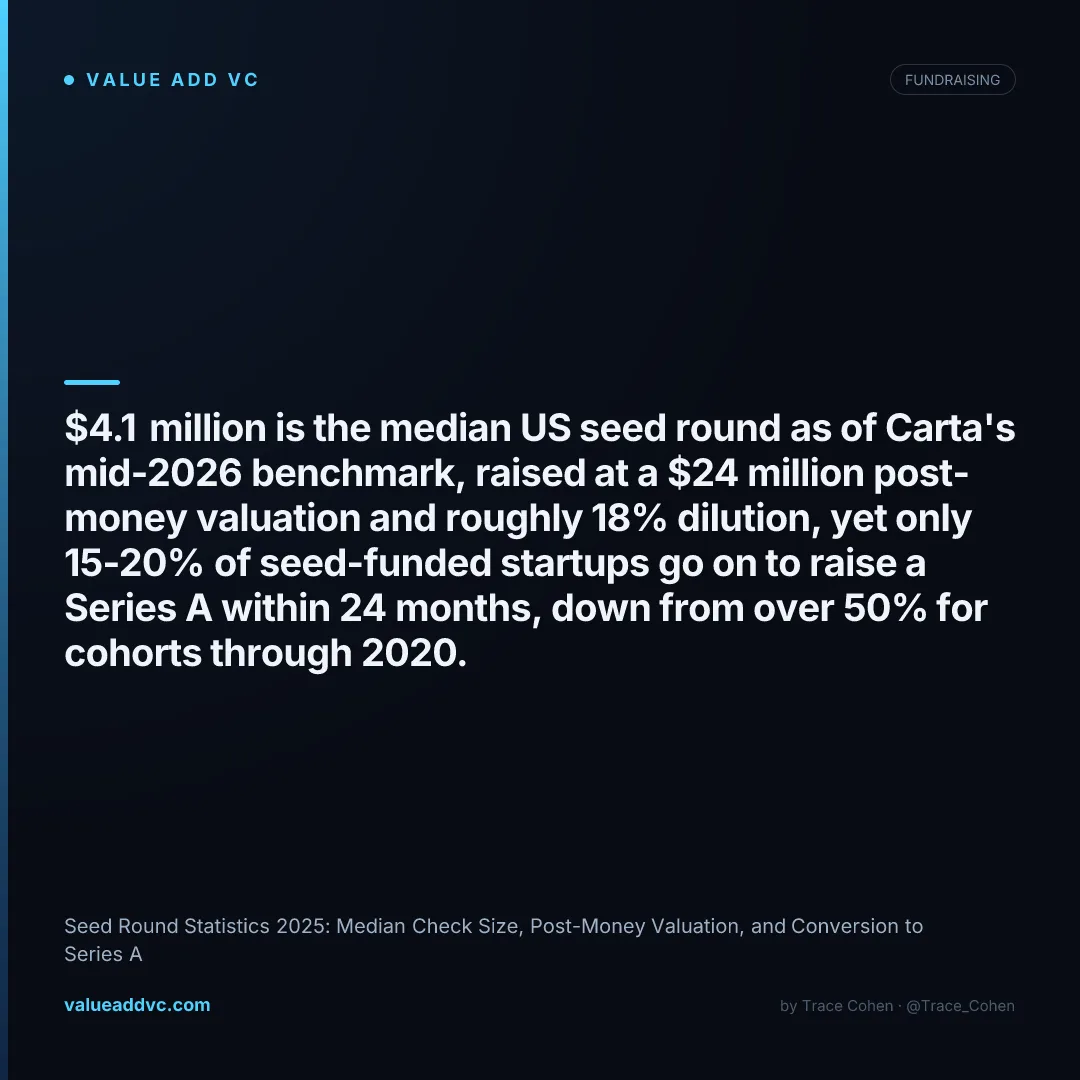
The median US seed round is $4.1 million at a $24 million post-money valuation as of Carta's mid-2026 benchmark data — roughly 18% dilution — yet only 15-20% of those companies will reach a Series A within two years.
That is the tension every founder needs to understand before they raise. Seed checks and valuations kept climbing through 2026, but the bar to graduate to a priced Series A has risen faster than the money. Bigger seed, narrower funnel. The numbers below come from Carta's State of Pre-Seed and Seed data, the Q2 2026 PitchBook-NVCA Venture Monitor, and Crunchbase, and as of September 2026 they tell a more sobering story than the headline round sizes suggest. Founders building their own comp set on a budget can lean on no-cost alternatives to paid funding databases.
Seed Round Statistics 2025: The Headline Numbers
Full-year 2025 closed with a median US seed round of about $3.2 million at an $18 million post-money valuation, per Carta's own retrospective data. By Carta's mid-2026 benchmark, published July 2026, the median seed round had jumped to $4.1 million at a record $24 million post-money valuation, with founders parting with about 18% of their company. Round sizes and valuations are the highest on record according to Carta, but only 15-20% of seed-funded startups raise an institutional Series A within 24 months — less than half the graduation rate seen for cohorts through 2020.
Part of the median's rise is a genuine shift in round composition, not just AI hype: US seed rounds of $10 million or more grew from about 2% of all seed deals in 2018 to roughly 9% in 2025, per Crunchbase News. A fatter tail of large, mostly AI-adjacent rounds pulls the median up even when the typical non-AI deal has barely moved — which is exactly why the sector table below matters more than the headline figure for most founders.
Seed Round Size and Valuation by Year
The clearest way to read seed round statistics is the multi-year trend. Round sizes climbed steadily, post-money valuations re-inflated well past their 2021 peak, and the increase accelerated sharply between full-year 2025 and Carta's mid-2026 benchmark.
| Year | Median Round | Median Post-Money | Median Dilution |
|---|---|---|---|
| 2021 | $2.8M | $13M | ~20% |
| 2022 | $3.0M | $14M | ~20% |
| 2023 | $3.1M | $14.5M | ~19% |
| 2024 | $3.1M | $15M | ~18-19% |
| 2025 | $3.2M | $18M | ~18% |
| 2026 | $4.1M | $24M | ~18% |
2021-2024 figures are blended estimates from Carta, PitchBook-NVCA, and AngelList early-stage financing data. 2025 and 2026 figures are Carta's own reported medians from its Q1 2026 retrospective and mid-2026 (published July 2026) State of Pre-Seed and Seed benchmarks. You can benchmark your own round against live comparables on the Value Add VC benchmarking dashboard.
One caveat worth stating plainly: Carta's benchmarks are built from companies that use Carta's own cap-table software, which skews toward venture-backed US startups with formal SAFEs or priced equity on file — it is a large, real sample, not a census of every seed deal in the country. PitchBook-NVCA and Crunchbase News pull from disclosed and reported deals instead, which is why their medians and growth rates don't always line up exactly with Carta's. This is analysis, not a knock on any single source: when three independently-collected datasets all show round sizes rising and Series A graduation falling over the same period, that directional agreement is more informative than any single number in isolation.
Seed Round Statistics by Sector in 2026
The median masks enormous sector variance. AI and machine-learning seed rounds in 2026 carry roughly a 44% valuation premium over the broad market, driven by compute costs and competitive investor demand for category leaders. Consumer and pre-product startups sit at the bottom of the range. For the full ranked breakdown, see our seed round size by sector deep dive.
| Sector | Median Round | Premium vs. Median |
|---|---|---|
| AI & Frontier Tech | $4.6M | +44% |
| Healthcare / Biotech | $4M-$5M | +41% |
| Defense / Space Tech | $3.25M | +2% |
| Fintech | $3M-$4M | +9% |
| Enterprise SaaS | $2.5M-$3.2M | -11% |
| Consumer Apps | $1.5M-$2.5M | -38% |
Premium is the sector median seed round size relative to the $3.2M broad-market median. Figures sourced from Carta's Q1 2026 sector cuts and Crunchbase News sector funding trackers, checked August-September 2026. SaaS valuation context cross-checked against public comps on the SaaS valuations dashboard.
The practical implication for a founder raising outside AI, healthcare, or defense: anchor your target check and post-money to your specific sector's numbers, not the blended $4.1M/$24M headline. An enterprise SaaS founder pitching a $4M seed at a $24M post-money because "that's the 2026 median" is effectively asking investors to pay an AI-level price for a non-AI risk profile, and will likely get pushed back toward the $2.5M-$3.2M range that actually clears for comparable SaaS deals this year.
Seed to Series A Conversion: The Number That Actually Matters
If you only take one statistic from this post, make it this: the majority of seed-funded companies never raise an institutional Series A. Carta's own graduation-rate tracking puts the 24-month conversion rate at roughly 15-20% today, down from about 25-30% for the 2018 cohort. Crunchbase News measures it differently — tracking whether a $1 million-plus seed round eventually progressed to any later round — and found an even sharper drop: 55%+ for cohorts through 2020, down to 24% for the 2023 cohort and just 16% for the 2024 cohort.
| Seed Vintage | Graduated to Series A | Window | Source |
|---|---|---|---|
| Through 2020 | 55%+ | eventual | Crunchbase News |
| 2018 | ~25-30% | 24 months | Carta |
| 2022 | ~17% | 24 months | Carta |
| 2023 | 24% | eventual (as of 2026) | Crunchbase News |
| 2024 | 16% | eventual (as of 2026) | Crunchbase News |
| 2025 | 10-11% | 12 months, still maturing | Carta |
Carta figures are from its seed-to-Series-A graduation-rate newsletter; Crunchbase News figures track whether a $1M+ seed round reached any later round (a broader definition than a priced Series A). The two methodologies aren't directly comparable row-for-row, but both point the same direction.
The Series A bar moved up
In 2021, a Series A often required roughly $1M ARR and a story. By the Q2 2026 PitchBook-NVCA Venture Monitor, the median Series A deal is $19.4M at a $78.7M+ post-money for the broader, AI-heavy market — though non-AI Series A rounds are still pricing closer to $40M-$42M pre-money. The milestone gap between a $24M seed and a Series A of that size has widened, and many companies simply cannot clear it on a single seed.
Seed got front-loaded
Larger seed rounds buy longer runway, so the median time from seed to Series A has stretched to roughly 18-24 months, up from 12-14 months at the 2021 peak. Many founders now raise a seed extension or a second seed instead of graduating, which means the company is technically still "at seed" two years in — depressing the clean conversion number.
For founders, the practical takeaway is to raise a seed sized to clear the real Series A bar, not the one from a few years ago. For investors, it means seed reserves and the willingness to lead a bridge matter more than ever. The full vintage-level conversion and return data lives on the VC performance dashboard.
How Seed Rounds Are Structured in 2026
The mechanics behind these seed round statistics matter as much as the medians. Three structural facts define the 2026 seed market:
93% use SAFEs, not priced equity
The post-money SAFE is now the default seed instrument, per Carta's Q2 2026 data. The median seed valuation cap sits around $18-24M, and most rounds never see a priced lead until Series A.
Stacked SAFEs hide real dilution
Founders raising on multiple caps over 12-18 months frequently underestimate total dilution. Three SAFEs at different caps can convert to 25%+ combined ownership when the priced round finally happens.
Party rounds are common at seed
A typical $4.1M seed in 2026 often has 8-15 investors rather than one lead writing the whole check. That spreads risk but can leave companies without a committed lead to drive the next round.
The Dilution Math Behind a $4.1M Seed at a $24M Post-Money
Founders often skip past the arithmetic behind the headline numbers, so it's worth spelling out. A $4.1M seed round on a $24M post-money valuation means the pre-money valuation is $19.9M ($24M post-money minus the $4.1M raised), and the round sells roughly 17.1% of the company ($4.1M / $24M). Once you layer in a typical 10% option pool refresh built into the same round, effective founder dilution lands closer to the 18% median Carta reports — the gap between the simple math and the reported median is almost always the option pool.
That math changes fast with stacked SAFEs. A founder who raises a $1.5M pre-seed SAFE at a $9M cap, then a $2.6M seed SAFE at a $22M cap, is not diluted 17-18% once — both SAFEs convert simultaneously at the next priced round (typically Series A), and the combined dilution depends on which caps are lowest relative to the eventual price. Founders who raise three or more SAFEs across 18-24 months without modeling the combined conversion routinely discover 5-10 percentage points of dilution they did not expect on the cap table the day their Series A actually prices.
The practical fix is simple but underused: model every outstanding SAFE against a range of plausible Series A prices before signing the next one, not after. A $500K difference in seed round size at the same cap can move combined dilution by a percentage point or more once multiple instruments stack — small enough to ignore in a single round, large enough to matter across a full seed-to-Series-A cap table.
What Changed Since This Post First Published (June 2026)
When this piece first ran on June 23, 2026, it cited a $3.4M median seed round at a $16M post-money valuation and a 13-15% seed-to-Series-A conversion rate, sourced from a blend of Carta, PitchBook, and AngelList data available at the time. Re-checking against Carta's own published benchmarks as of September 2026 turned up more precise, directly-sourced figures: the actual full-year 2025 median was closer to $3.2M at an $18M post-money, and Carta's mid-2026 six-month benchmark (published July 2026) puts the current median at $4.1M and $24M post-money. The Series A conversion rate, per Carta's own graduation-rate newsletter, sits at roughly 15-20% at 24 months rather than 13-15% — still a brutal filter, just measured slightly differently than the original estimate.
What the headline misses
The jump from $3.2M to $4.1M in a single Carta reporting cycle is real, but it is also a median, not a distribution — a relatively small number of large AI seed rounds can move it more than a broad shift in the typical deal would. Non-AI founders benchmarking against the $4.1M/$24M headline risk overestimating what they can actually raise; Carta's own sector cuts put non-AI software closer to $14M-$17M post-money, well below the blended number. One read on this: the seed market isn't uniformly bigger in 2026, it's more bimodal, with AI and a handful of other capital-intensive categories pulling the average up while most non-AI seed rounds have grown far more modestly.
The seed market in 2026 is generous with capital and brutal with graduation.
Raise a $4.1M seed if you can — but size it to clear a Series A bar that only 1 in 5 to 1 in 7 companies actually reaches.
Benchmark your round against live data on the Benchmarking Dashboard at Value Add VC. Originally published in the Trace Cohen newsletter.
Latest from the Pulse
Get VC data most people never see
— 100% free
Weekly benchmarks, valuations, and fund data. Join 5,000+ investors. No spam.