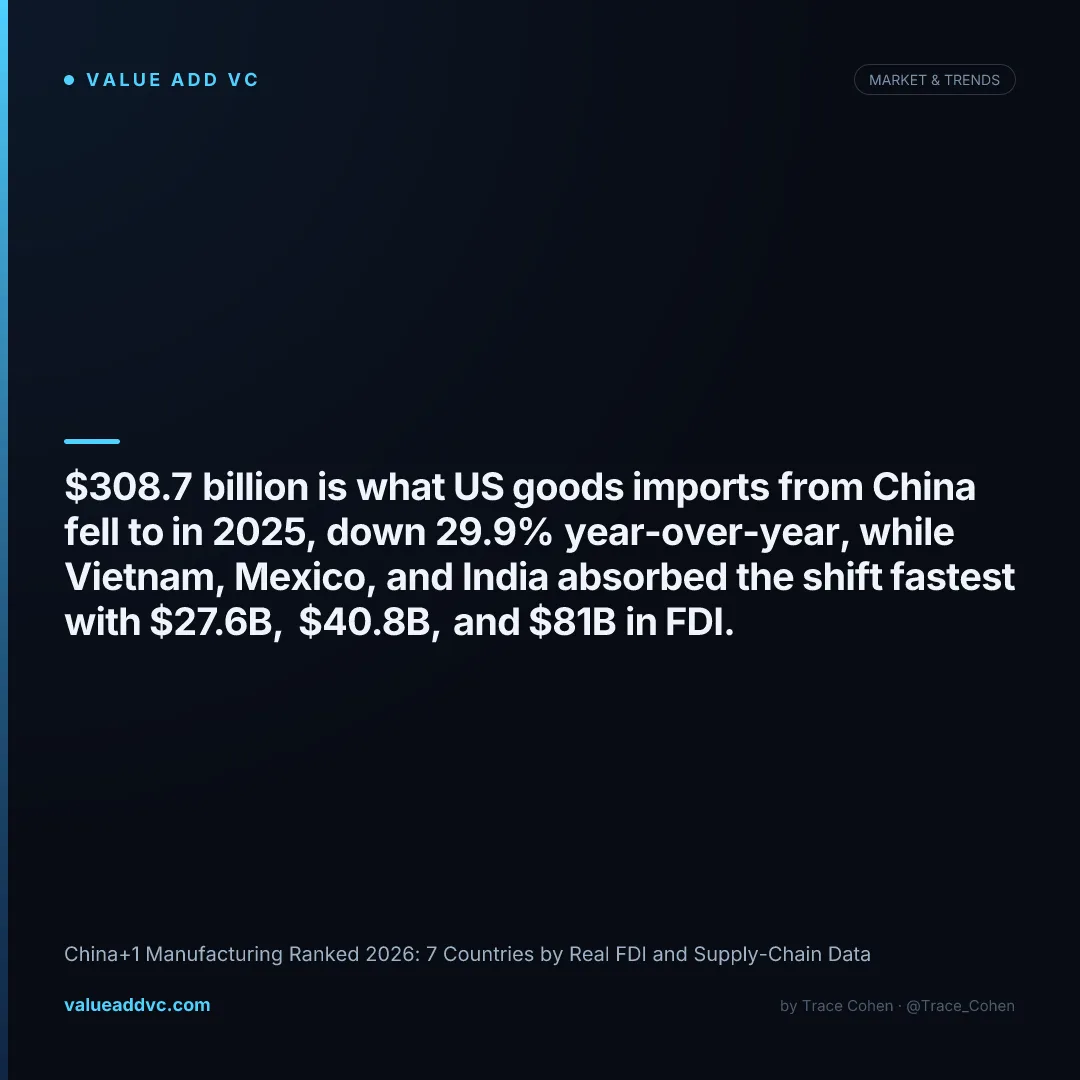
US goods imports from China fell 29.9% to $308.7B in 2025, and Vietnam, Mexico, and India are absorbing the shift fastest — but at least two of the seven countries brands call "China+1" are majority-funded by Chinese capital itself.
That's the short answer. The longer answer is that "diversifying away from China" means very different things depending on which country you're looking at. Some — Vietnam, Mexico, Malaysia — are building genuinely independent capacity. Others — Cambodia, Thailand — are increasingly just China's own factories relocating a border or two away to dodge tariffs, which defeats the purpose for any founder or brand actually trying to de-risk. I ranked all seven on the real 2025-2026 data below, and updated this piece in September 2026 to cover the transshipment crackdown Washington launched in August — a development that changes how much scrutiny each of these supply chains is about to face, without changing which ones were ever real to begin with.
What is the China+1 manufacturing strategy in 2026?
China+1 manufacturing is the practice of keeping some production in China while adding at least one additional country to reduce tariff exposure, geopolitical risk, and single-source dependency. It went from a hedge to a mandate after 2025's tariff escalations: US goods imports from China dropped 29.9% year-over-year to $308.7 billion in 2025, down from $536 billion in 2022, and fell a further 35% year-over-year in January 2026 alone.
A 2024 BCG survey of 180 listed EU manufacturers found 91% had already written "China Plus One" into their 2025-26 ESG reporting, with 47% attaching measurable KPIs to it. This is no longer a theoretical hedge board decks mention once a year — it's a line item with targets attached, and the countries below are where that capital is actually landing.
The math behind that shift is the blended US tariff on Chinese goods, which the Peterson Institute for International Economics puts at roughly 33% in 2026 once every layer stacks: a base MFN rate near 3.4%, Section 301 tariffs of 7.5-25% on specific product categories, a 20% IEEPA fentanyl-related tariff applied across the board, and a 10% reciprocal tariff carried over from the US-China truce reached in October 2025. Washington added another 12.5-point Section 301 tariff on July 24, 2026, and the truce itself only runs through August 2026, so the 33% effective rate is a floor rather than a ceiling — the single biggest reason the countries ranked below keep pulling capital even in a year when the truce technically held.
China+1 manufacturing destinations ranked: the 7 countries absorbing the shift
Ranked by how genuinely independent the diversification actually is — not just by raw dollar volume — using 2025-2026 FDI figures, production share data, and disclosed ownership structure where it's available. A country with smaller total FDI but a higher share of manufacturing-specific, non-Chinese capital ranks above a country with a bigger headline number that's mostly relocated Chinese ownership.
Indonesia figure is estimated at ~50.1% of 2025's IDR 1,931.2 trillion total investment realization, based on the FDI/DDI split BKPM reported for Q1 2026, converted at approximately 16,300 IDR/USD.
Vietnam vs Mexico vs India: which China+1 country actually fits your supply chain
| Country | 2025 FDI | Manufacturing share of FDI | Signature sector | China dependency risk |
|---|---|---|---|---|
| Vietnam | $27.6B | 82.8% ($22.9B) | Electronics, footwear (Nike 52%) | Moderate — Chinese components in electronics assembly |
| Mexico | $40.8B | Not fully broken out | Automotive (Japan $18B committed) | Low — driven by USMCA and US-market proximity |
| India | $81.0B | Cumulative $184.15B, 2014-2025 | Electronics (25% of iPhones), pharma | High — 71% of iPhone components still Chinese |
| Malaysia | $15.4B | $100B+ committed (semiconductors) | Advanced chip packaging | Low — genuine niche capability build-out |
| Indonesia | ~$59.0B (est.) | Declined in Q2 2025 | Footwear (Nike 27%) | Unclear — FDI/DDI split not cleanly reported |
| Cambodia | $5.2B | +50% growth, 2025 | Apparel, footwear, travel goods | Very high — 70%+ of FDI is Chinese-owned |
| Thailand | $7.4B | $3.9B to $5.1B, 2017-19 to 2022-24 | EVs, autos | Very high — China is 44% of manufacturing FDI |
Figures are 2025-2026 estimates blended from Vietnam-Briefing, Trading Economics, Kearney's FDI Confidence Index, India's DPIIT, MIDA Malaysia, Indonesia's BKPM, Cambodia Investment Review, and Thailand's BOI. Manufacturing-specific FDI is not consistently disclosed across all seven countries, so several rows use total national FDI as the closest available proxy.
The China+1 strategy's dirty secret: some of it is still China
The headline number everyone quotes — US imports from China down 29.9% to $308.7B in 2025 — makes the shift look cleaner than it is. By January 2026, Mexico ($45.6B), the EU ($40.7B), Canada ($29.8B), Taiwan ($22.7B), and even Vietnam ($20.4B) each supplied more monthly US imports than China ($21.2B). That's a genuinely new trade map.
But look one layer down and the picture gets messier. Cambodia's manufacturing investment is growing 50% a year, yet Chinese investors wrote more than 70% of the checks funding that growth in 2025. Thailand is a textbook China+1 case study in every trade publication, yet China itself is now 44% of Thailand's manufacturing FDI, with Chinese EV makers like Changan and Great Wall building factories there specifically to re-export around tariffs aimed at China. And in India — the most celebrated diversification story of the last three years — 71% of the components inside an India-assembled iPhone are still sourced from China, with local value addition stuck at 18-20% against a 35-40% target.
For founders and operators building supply chains, that distinction matters more than the country name on the factory. A tariff-driven trade route change (Cambodia, Thailand) is not the same as an independent industrial base (Vietnam's electronics ecosystem, Malaysia's semiconductor packaging push). One survives a tariff renegotiation; the other doesn't. Anyone underwriting supply-chain risk for a portfolio company should ask where the capital — not just the factory — actually comes from, the same diligence question we apply when evaluating any infrastructure-heavy capex story.
2026 update: Washington's transshipment crackdown targets the China+1 loophole itself
On August 13, 2026, the White House released a report titled "The Great Transshipment Scam," which reframes a chunk of the China+1 story told above. The 25-page report flags more than 40 countries — Mexico, Vietnam, and India among them, alongside the EU, Japan, and South Korea — as high-risk points where Chinese-origin goods get relabeled to dodge US tariffs. The White House's own estimate: $19-26 billion a year in lost tariff revenue, with roughly $67 billion in 2025 goods flows through Mexico, India, and Vietnam tied to about $28 billion in evaded duties, according to reporting on the report's findings.
The clearest early evidence sits right on this list. Vietnam's exports to Mexico more than doubled in the first half of 2026, which Mexican trade officials and reporters now suspect is partly Chinese goods routed through Vietnam and then re-routed again through Mexico to reach the US market twice-removed from their origin. Mexico responded by raising tariffs at the start of 2026 on imports from countries it has no trade deal with — 1,463 product categories at rates from 5% to 50% — a direct response to pressure over exactly this kind of pass-through trade.
What the crackdown doesn't fix
This is where the ranking above gets more complicated, not less. Stricter rules-of-origin enforcement targets exactly the mechanism that makes Cambodia's and Thailand's numbers look better than they are, but it also puts genuine diversifiers like Vietnam and Mexico under the same compliance microscope — a Vietnamese factory that's 100% independently owned still has to prove it, shipment by shipment, once Customs and Border Protection starts treating the whole lane as suspect. One likely effect: higher compliance costs and longer customs delays for every company sourcing through these countries in 2026-2027, regardless of whether their supply chain is one of the "real" ones in this ranking or one of the relabeled ones.
It's also worth noting the crackdown hasn't visibly redirected capacity back to the US itself. The Reshoring Initiative's tally of domestic reshoring and foreign-direct-investment manufacturing jobs fell from about 245,000 announced in 2024 to an early-2025 pace pointing toward roughly 174,000 for the full year, per the group's own annual report — even as tariffs get cited as the deciding factor in 454% more reshoring cases than a year earlier. This likely means companies are still choosing a cheaper third country over building in the US when tariffs bite, which is the opposite of what "reshoring" policy is supposed to produce.
How founders and brands should actually use this ranking
If you're a hardware or consumer brand choosing a second manufacturing base in 2026, the practical filter is simple: match the country to the sector where its 2025-2026 data shows real, not borrowed, capability. Vietnam and Malaysia are the cleanest bets — Vietnam for anything electronics or apparel at scale, Malaysia specifically for advanced chip packaging where the $100B+ in committed capital is chasing a narrow, genuine capability gap. Mexico is the right call any time proximity to the US market and USMCA tariff treatment matter more than unit labor cost.
India and Indonesia are viable but require more diligence — India because the assembly layer has moved faster than the component supply chain underneath it, Indonesia because its own government data doesn't cleanly separate foreign from domestic capital. Cambodia and Thailand deserve the most skepticism: both show real headline growth, but a large share of that growth is Chinese capital re-routing through a third country to avoid tariffs aimed at China specifically, which is closer to tariff arbitrage than actual de-risking.
There's also a timing question worth underwriting separately from the dollar totals: Vietnam's electronics ecosystem took roughly a decade to build the depth it has today — Samsung, Intel, and Foxconn didn't show up in 2023, they've been compounding capacity since the mid-2010s. Malaysia's semiconductor packaging push is only a few years old and still ramping toward its 2035 target. A founder choosing a China+1 base today isn't just picking a country — they're picking a maturity curve. Vietnam and Mexico are late-stage, lower-surprise bets; Malaysia and India are earlier-stage bets where physical infrastructure is still catching up to the capital commitments already on the books.
One more filter after the August 2026 transshipment report: ask your freight forwarder or customs broker how much of your bill of materials by value actually changes form in the second country, not just where the box ships from. A factory that stamps, molds, or assembles a real majority of a product's value in Vietnam or Mexico clears rules-of-origin scrutiny fine. A warehouse that repackages Chinese-made components with a new country-of-origin label does not, and that's the exact behavior the crackdown is built to catch — meaning the compliance bar for claiming a Vietnam or Mexico origin is about to get materially higher than it was when most of this ranking's underlying deals were signed.
The Bottom Line:
US imports from China fell 29.9% to $308.7B in 2025, but "China+1" isn't one strategy — it's seven different bets with wildly different levels of real independence. Vietnam and Malaysia are building genuine capacity; Cambodia and Thailand are, in significant part, still China wearing a different flag.
The August 2026 transshipment crackdown is the newest wrinkle: it doesn't change which countries have real capacity, but it raises the compliance cost of proving it, for every company on this list.
Track how capital-intensive infrastructure bets are playing out on the Big Tech Earnings Dashboard and see how AI-native companies are valued on the AI Valuations Dashboard at Value Add VC. Originally published in the Trace Cohen newsletter.
Latest from the Pulse
Get VC data most people never see
— 100% free
Weekly benchmarks, valuations, and fund data. Join 5,000+ investors. No spam.